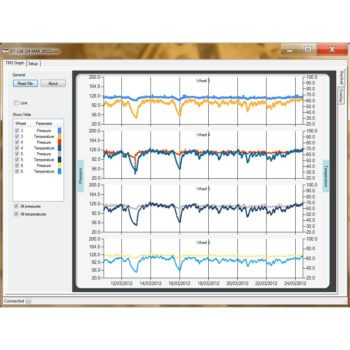
One of the innovative tire monitor systems we have developed is the TMS® Log Graph. This informative piece of software allows the user to analyse data from tires in an accessible manner, using visual reports and graphs. It?s a crucial piece of kit for OTR fleet managers who want to be able to clearly map the data they are receiving.
The TMS® log graph works by operating in tandem with the TMS® Manager. It takes the data created by the TMS® Manager, which allows the user to set configurations and alarm settings for tires, and gives the user the opportunity to create Excel files which can be converted into customs graphs and charts. It displays tire pressure and tire temperature for all of the tires that are being measured in a simple, effective manner.
 ® Log Graph” class=”wp-image-78″/>
It?s a vital tool for OTR firms monitoring tires as it takes the information from TMS® Manager and displays it so that fluctuations and trends in tire pressure and tire conditions can be easily viewed. Doing this allows OTR fleet managers to foresee any potential needs for tire changes and budget accordingly. It removes any potential for surprise blowouts or tire defects that would otherwise cause downtime and expensive tire changes which had not been budgeted for.
This software, the TMS® log graph, is another example of our commitment to creating systems with make tire pressure monitoring and OTR fleet management a more controlled and calculated business. Armed with this information it becomes easier to go down more inexpensive routes, such as altering driver habits, rather than having to divert part of your budget to meet unforeseen tire replacement costs.
The TMS® Log Graph software can be found on the downloads section of the TMS® website. Once downloaded you?ll need to follow the on screen instructions which will guide you through the installation process.
To discuss the TMS® Log Graph or any other innovative products which can aid your OTR monitoring and management of tires, contact us or call 01298 77166.